DATE: 2018
CLIENT: School Project
BRIEF: Turn raw data into a visual narrative about the life of Tony Pierce. With the use of 2 data sets, produce supporting evidence in the form of an infographic.
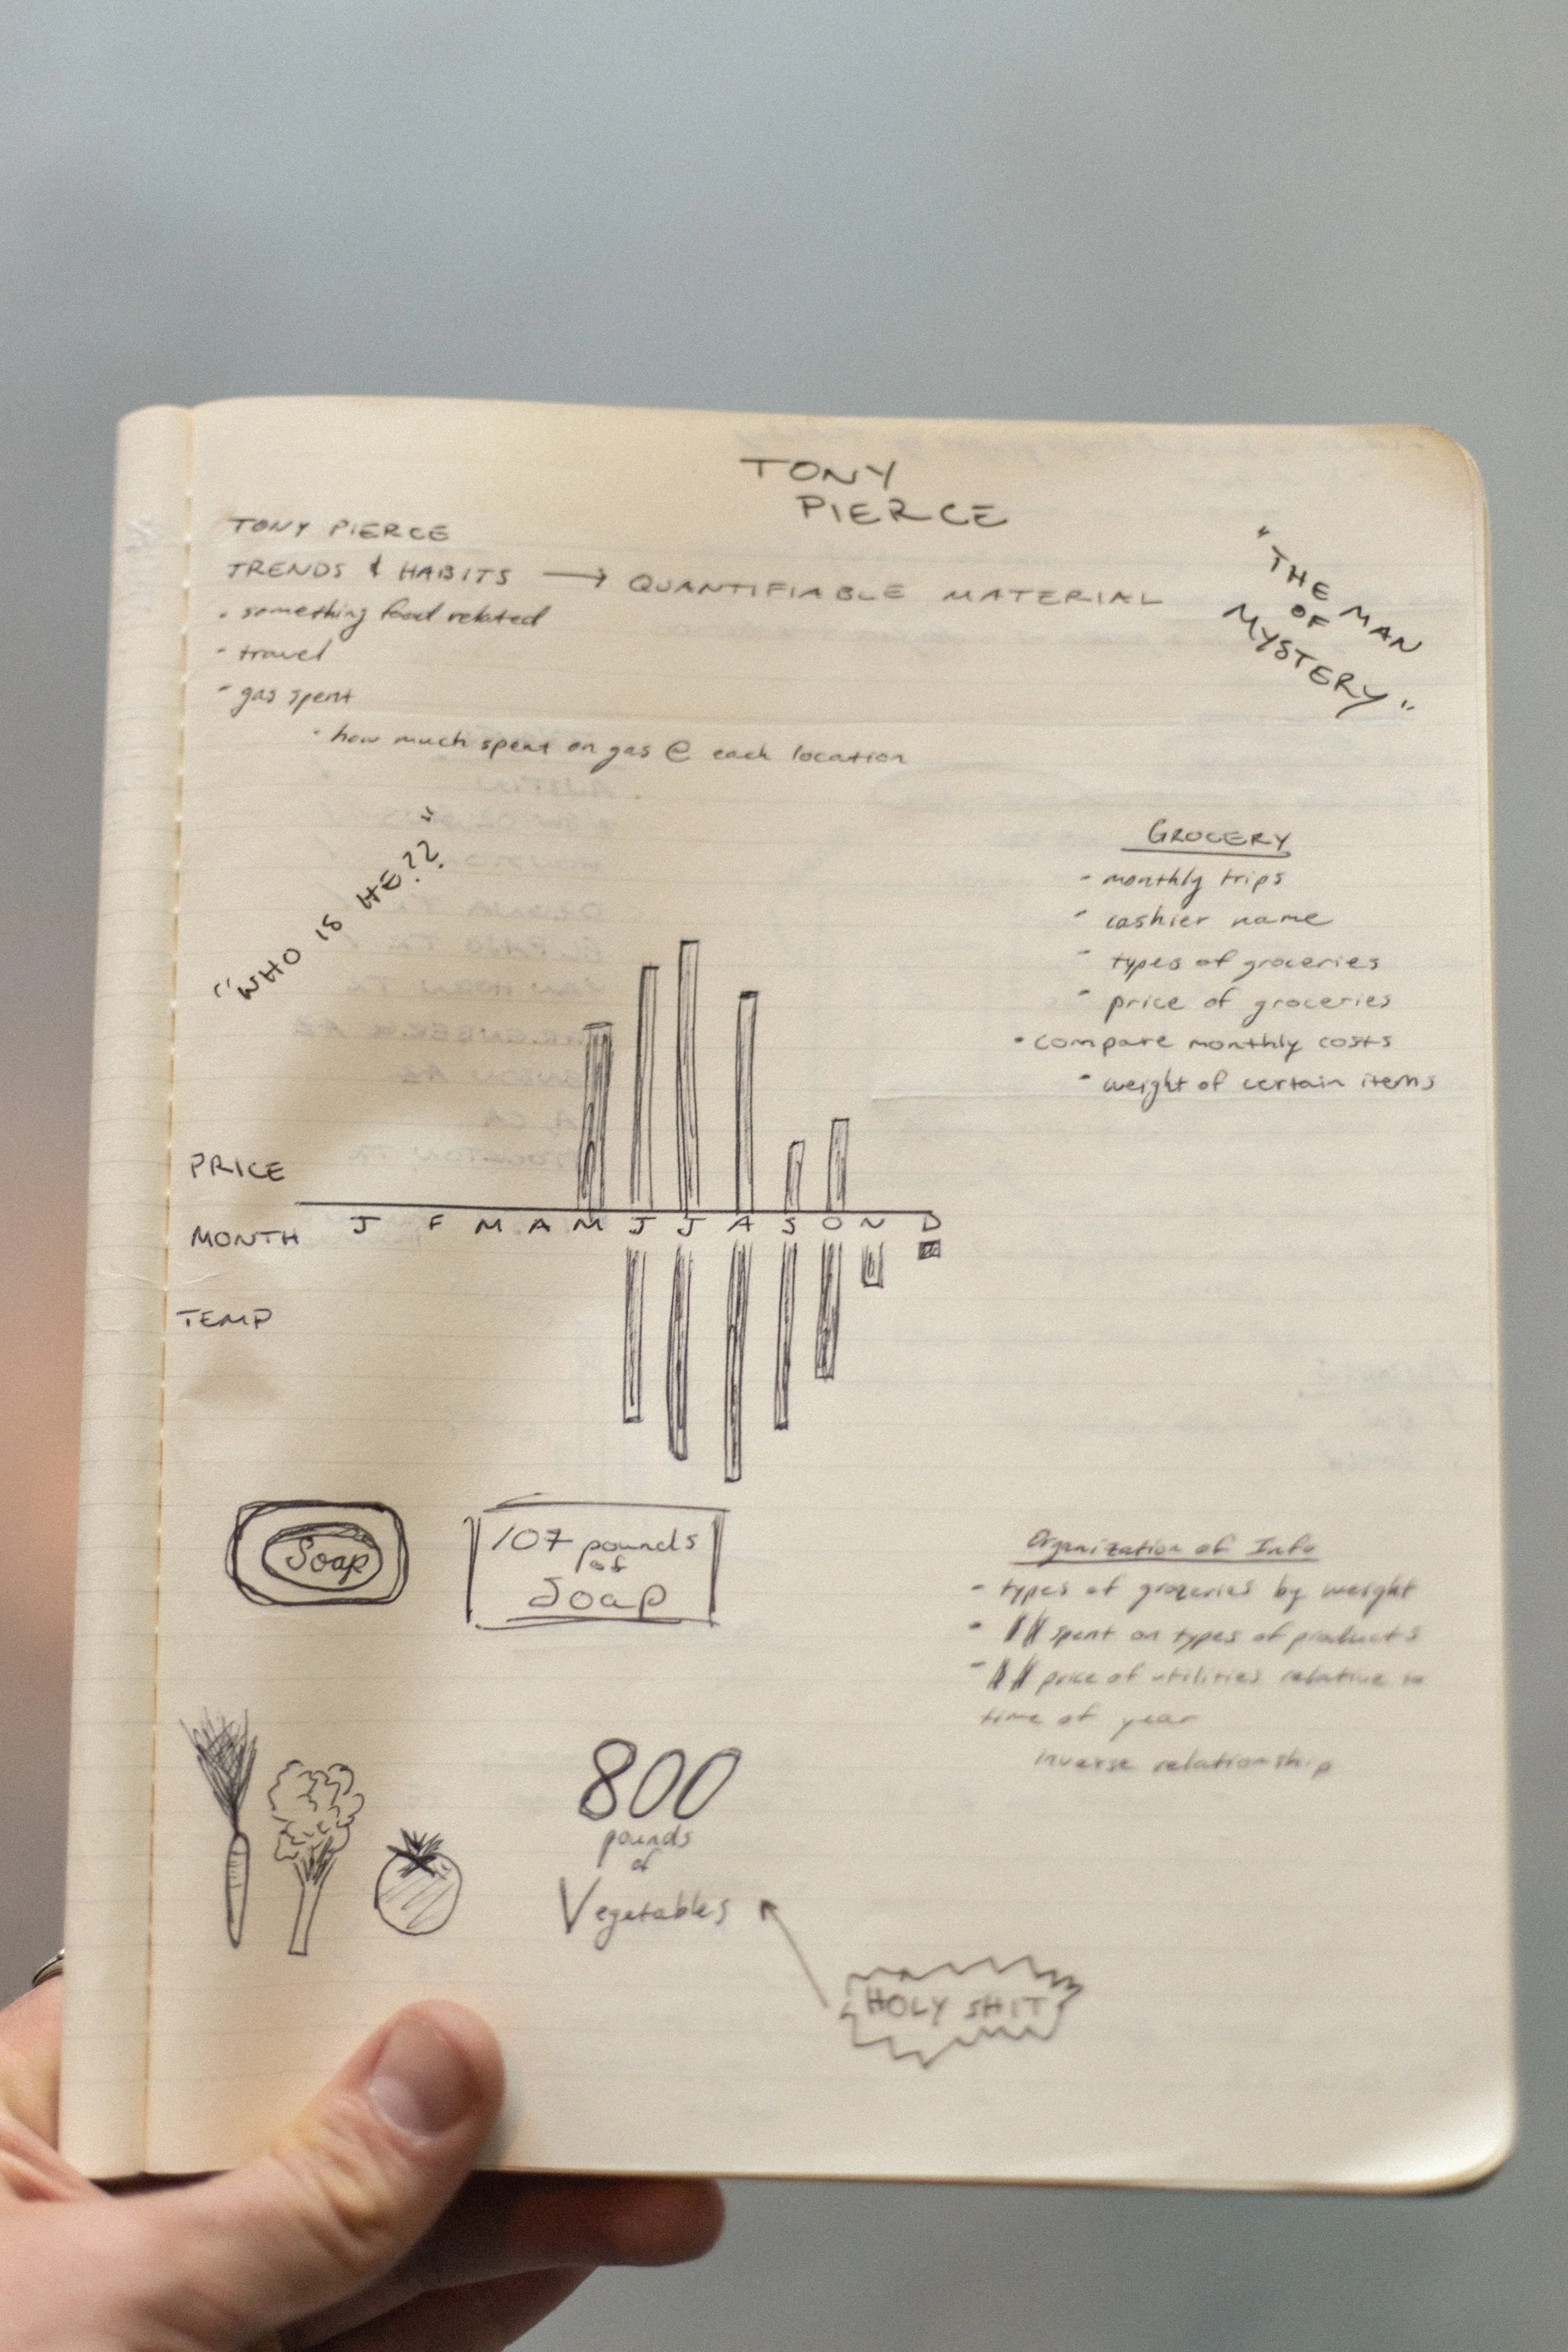
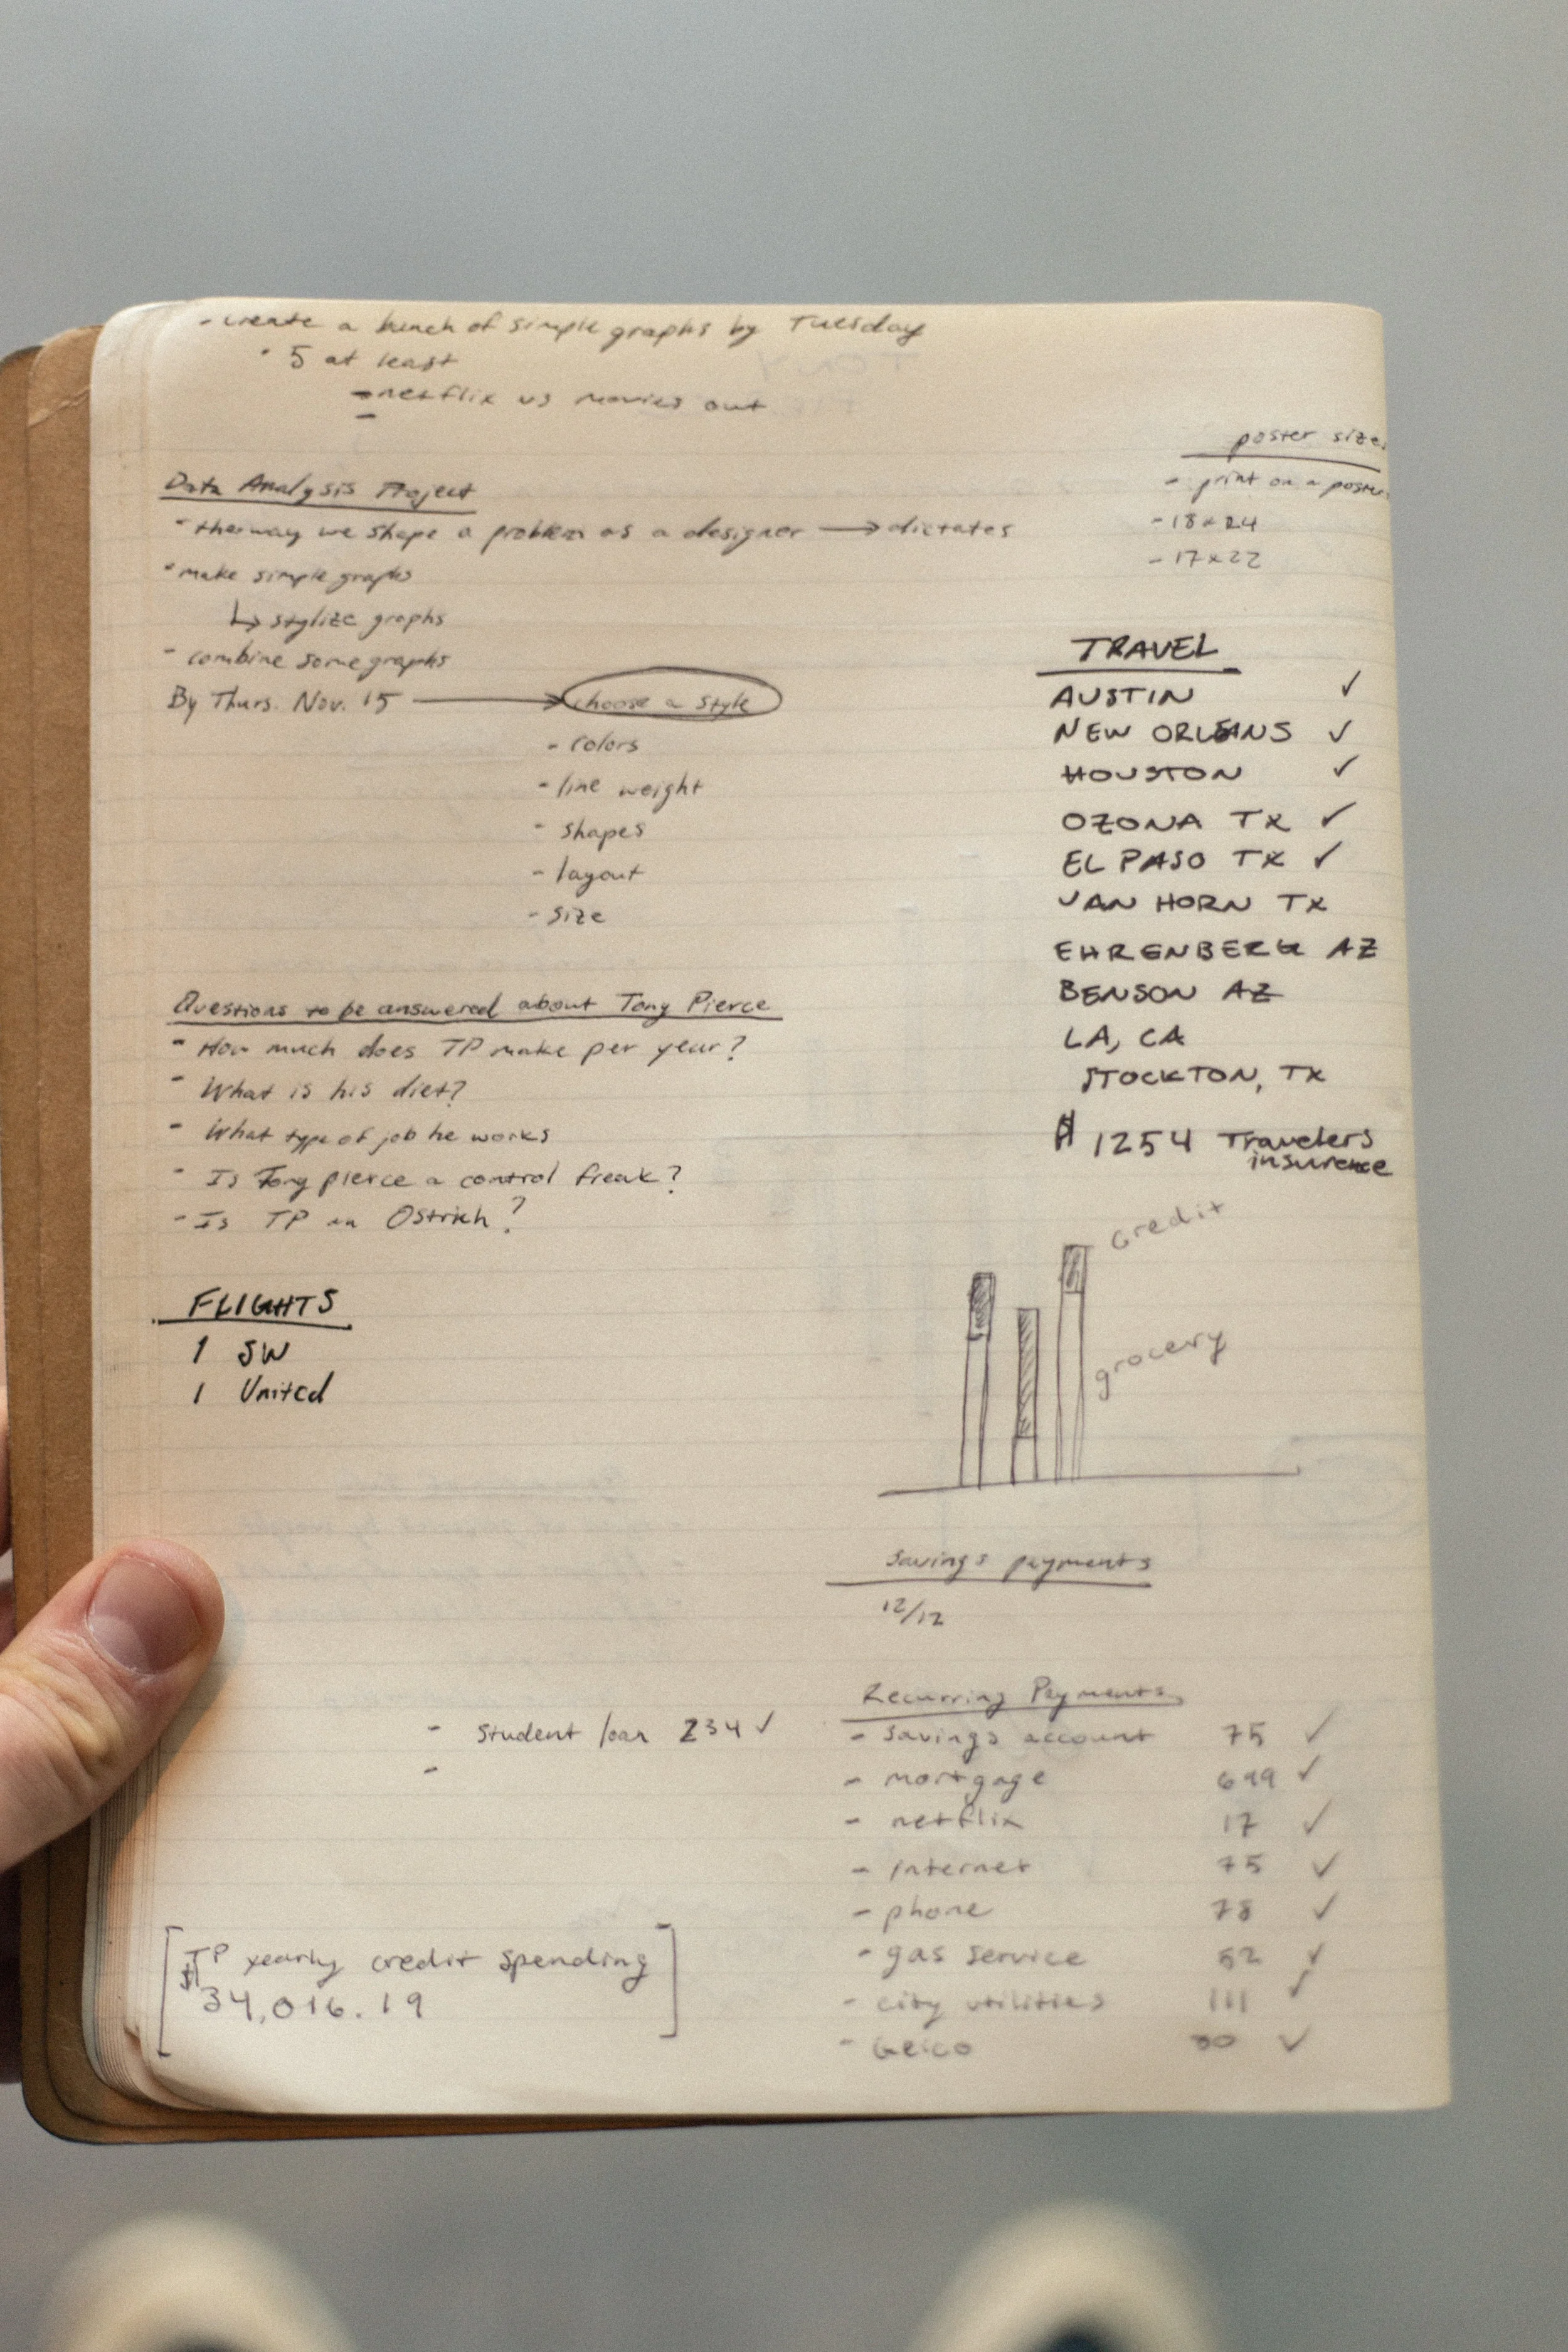
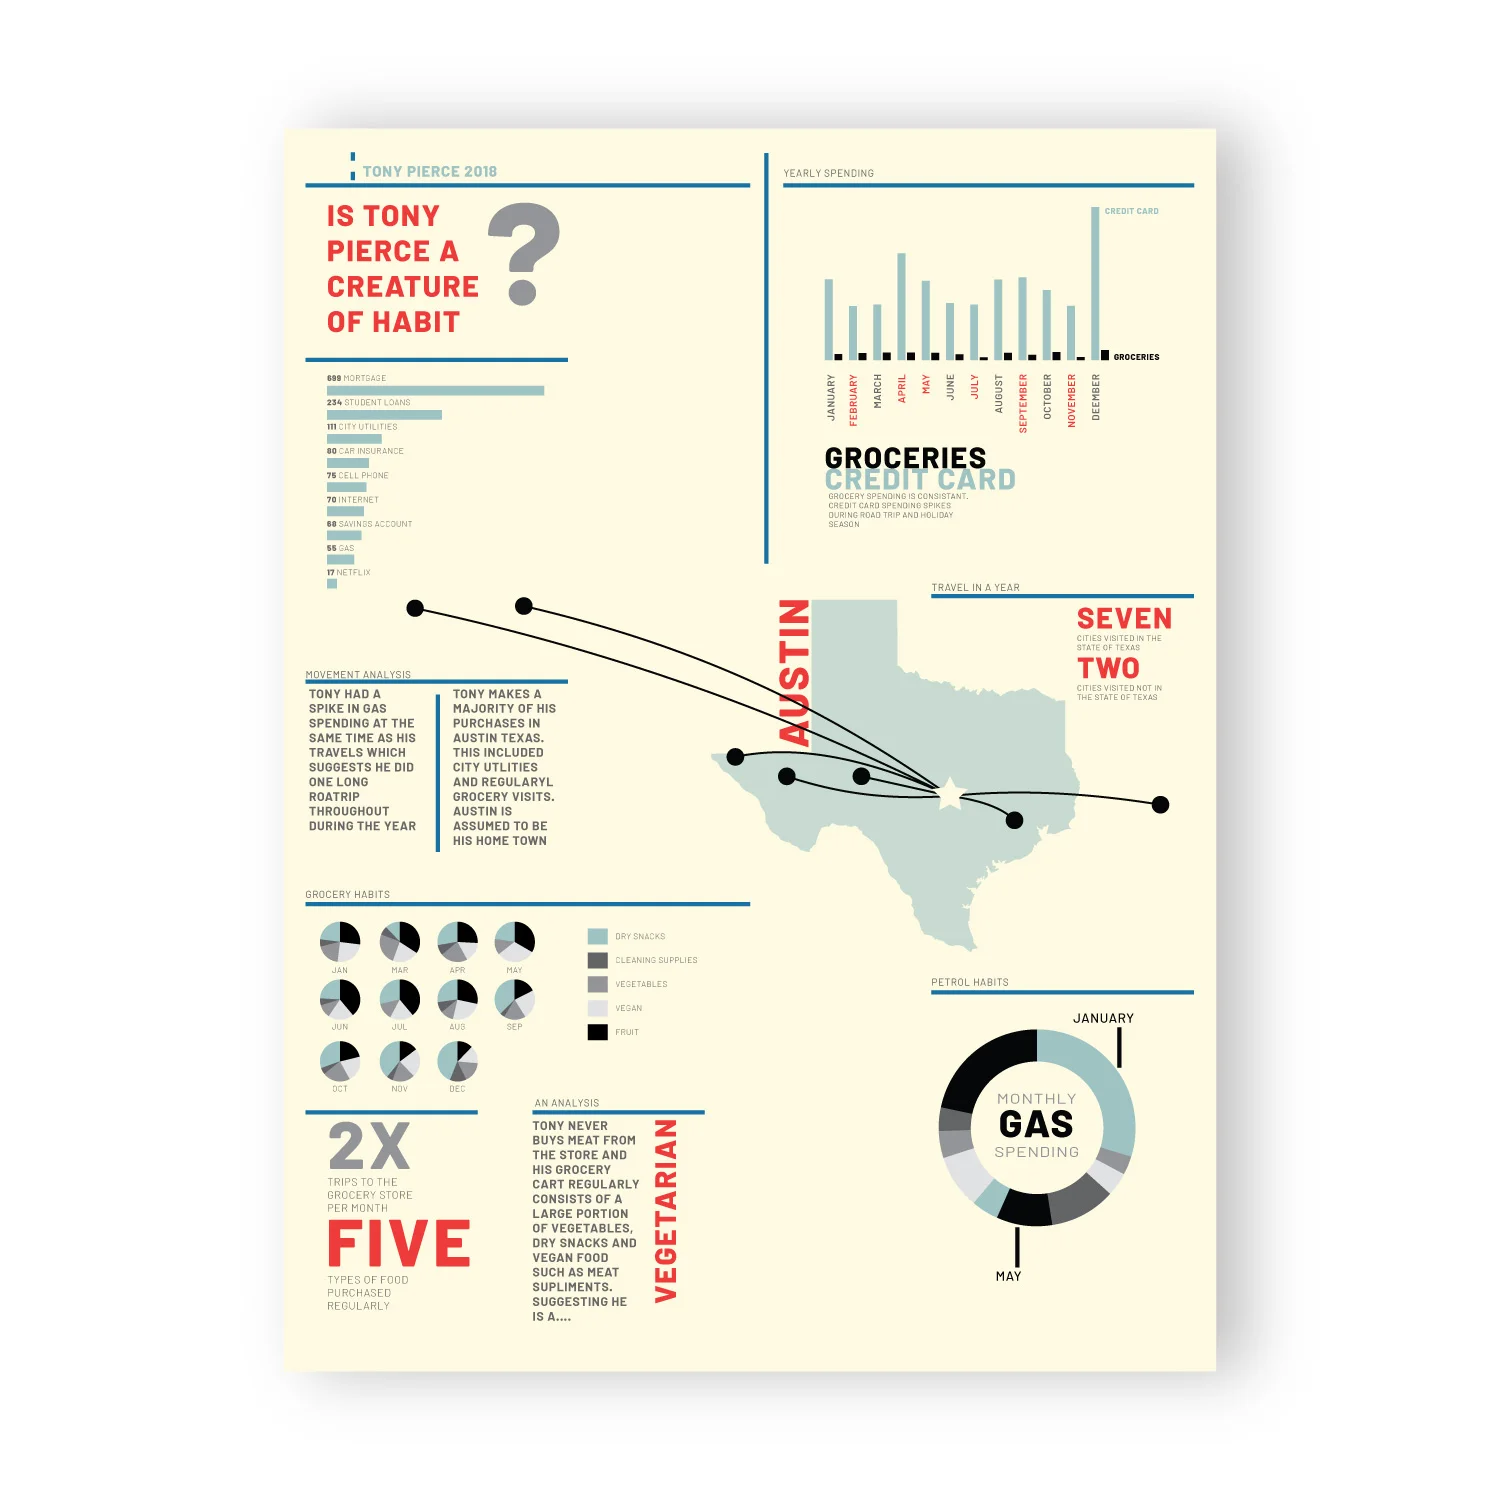
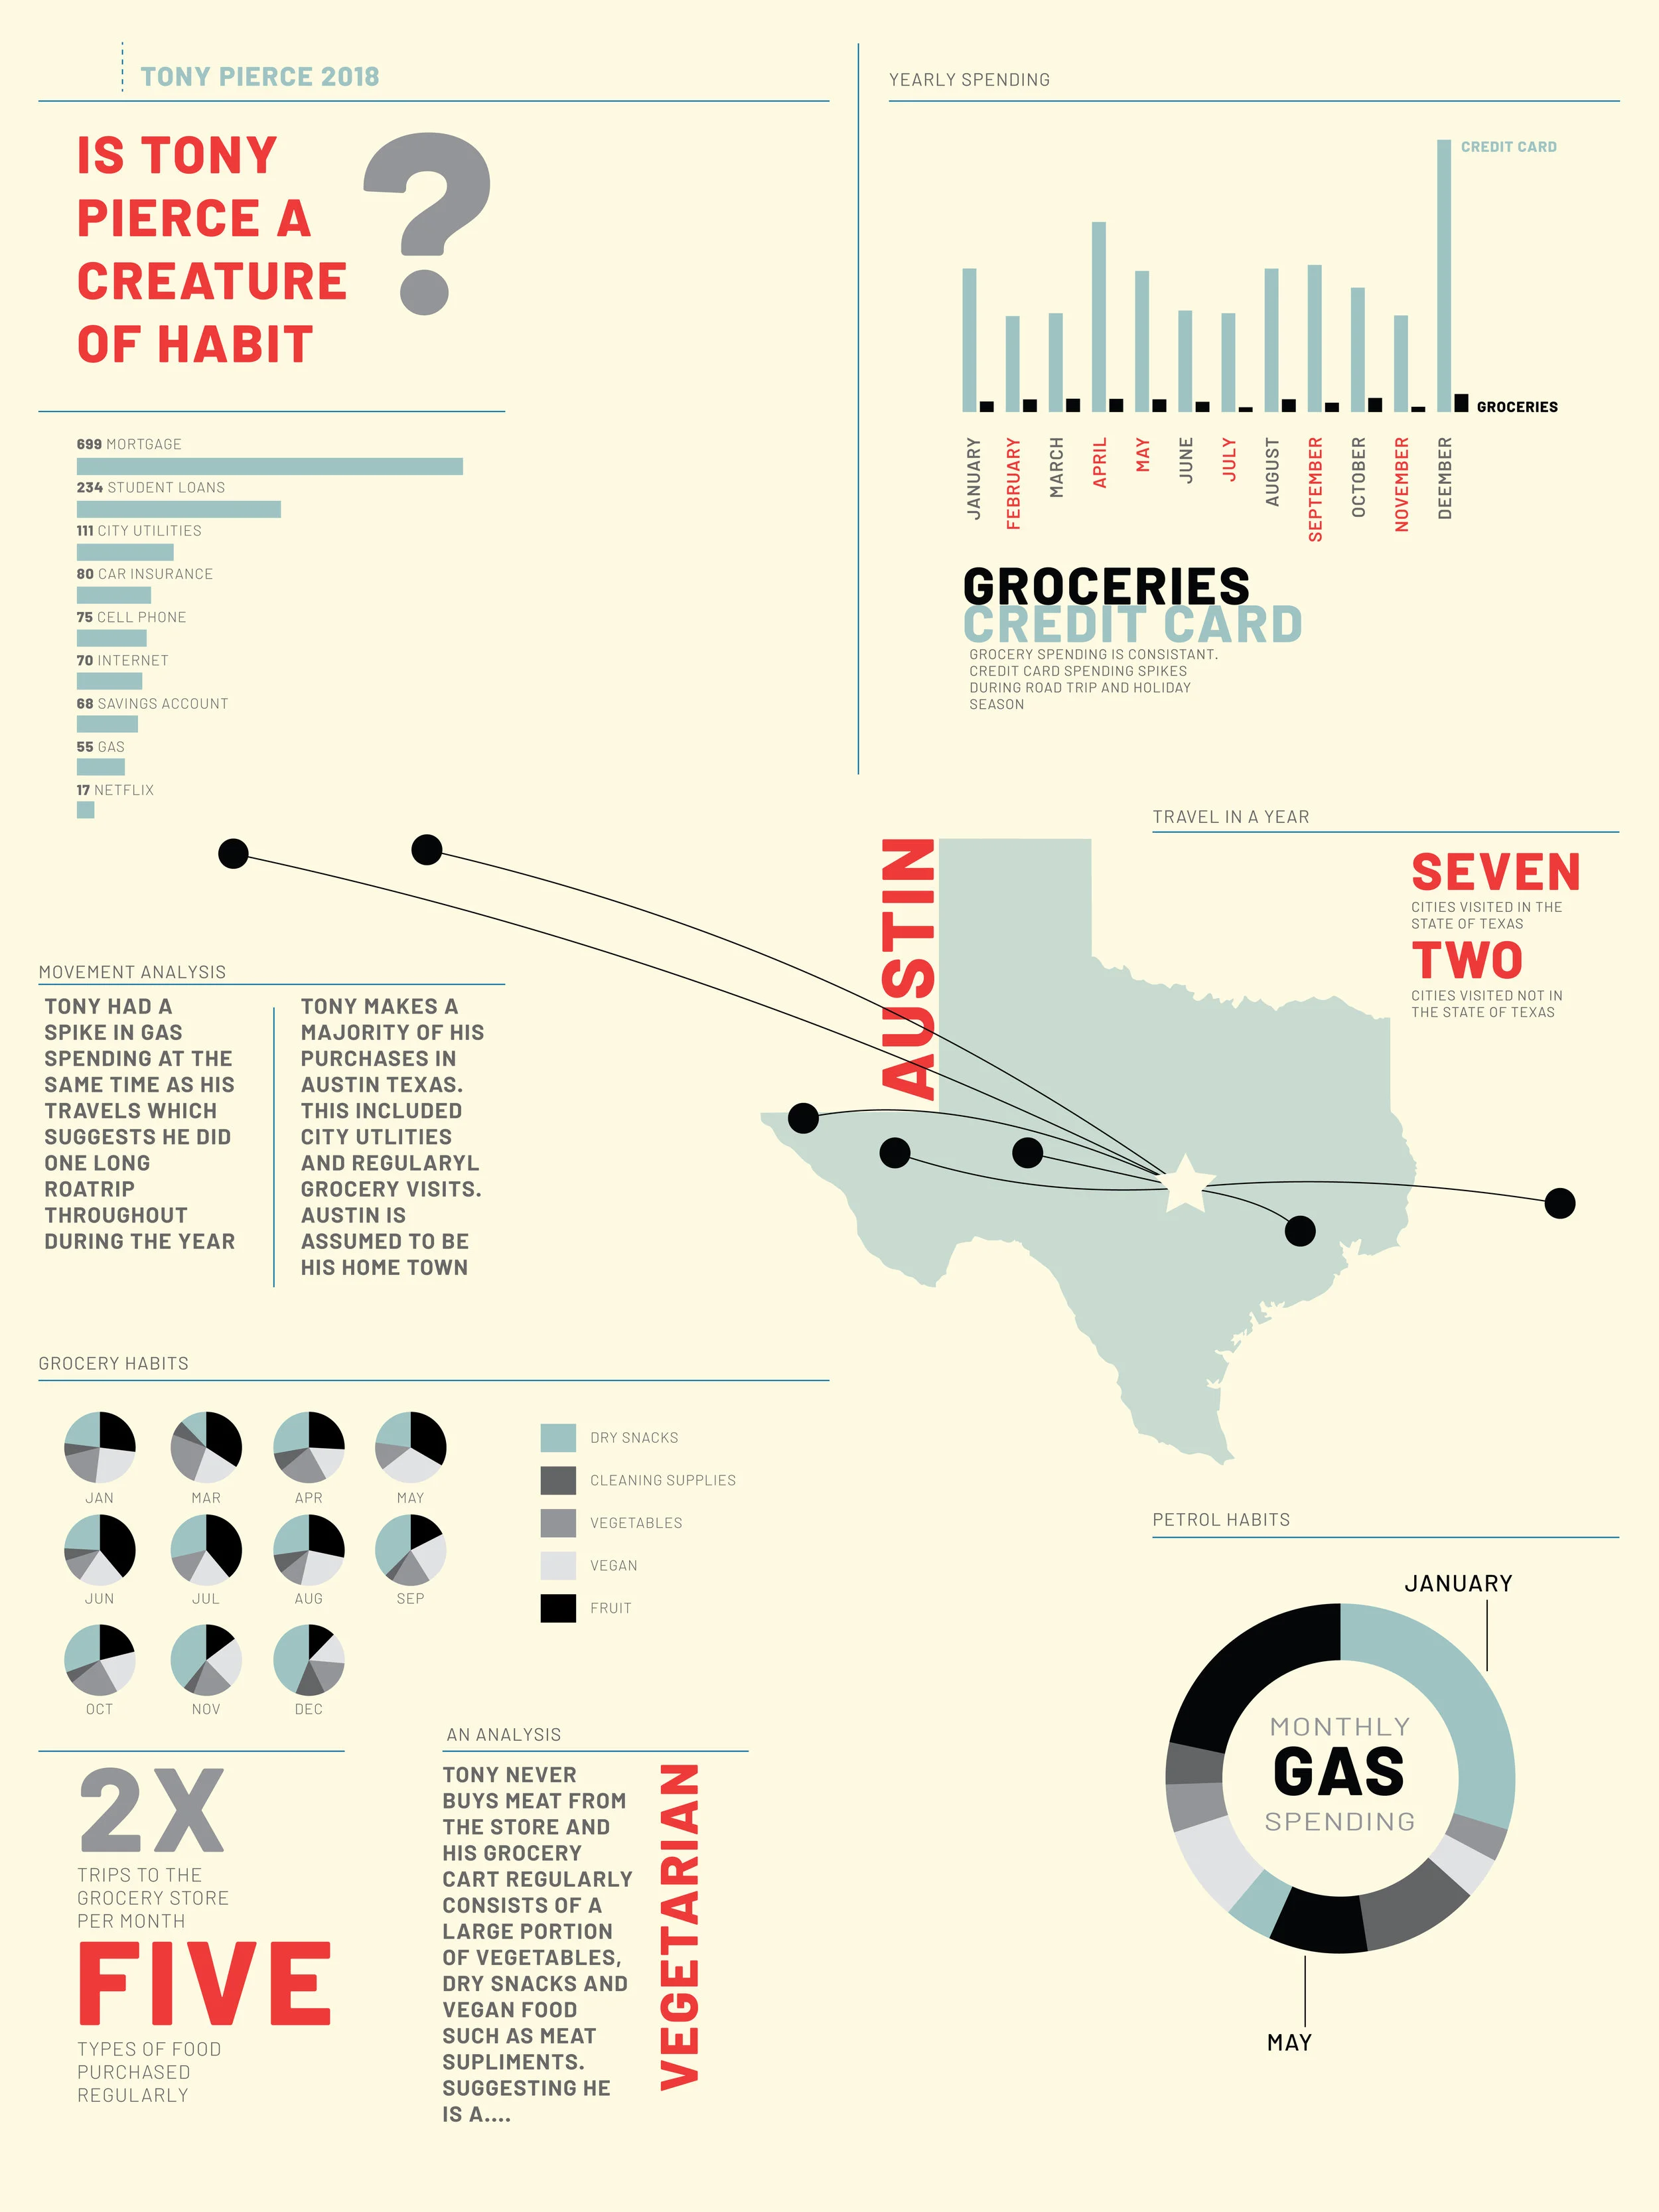
The data sets had limited information which set me up for an investigative approach to generating a storyline in visual form. I was able to see where Tony bought items, for how much, and on what date. Second, I categorized his habits such as the types of food he bought, how often, and in what quantity, relative to other items. This lead me to making valid assumptions of who this mysterious man might be and how I can characterize him. I displayed further evidence which make a case for potential travel, spending habits, and where he lives.
By giving this boring data a facelift, the information is not only more digestible but far more convincing and interesting.
TAKEAWAY
Turns out ‘Tony Pierce’ was an alias for my professor…so much for all the comments I made about his peculiar buying habits. Lucky I passed the class.